Application Screenshots
Explore the professional interface of Shoonya Trader. Designed for speed, clarity, and control.
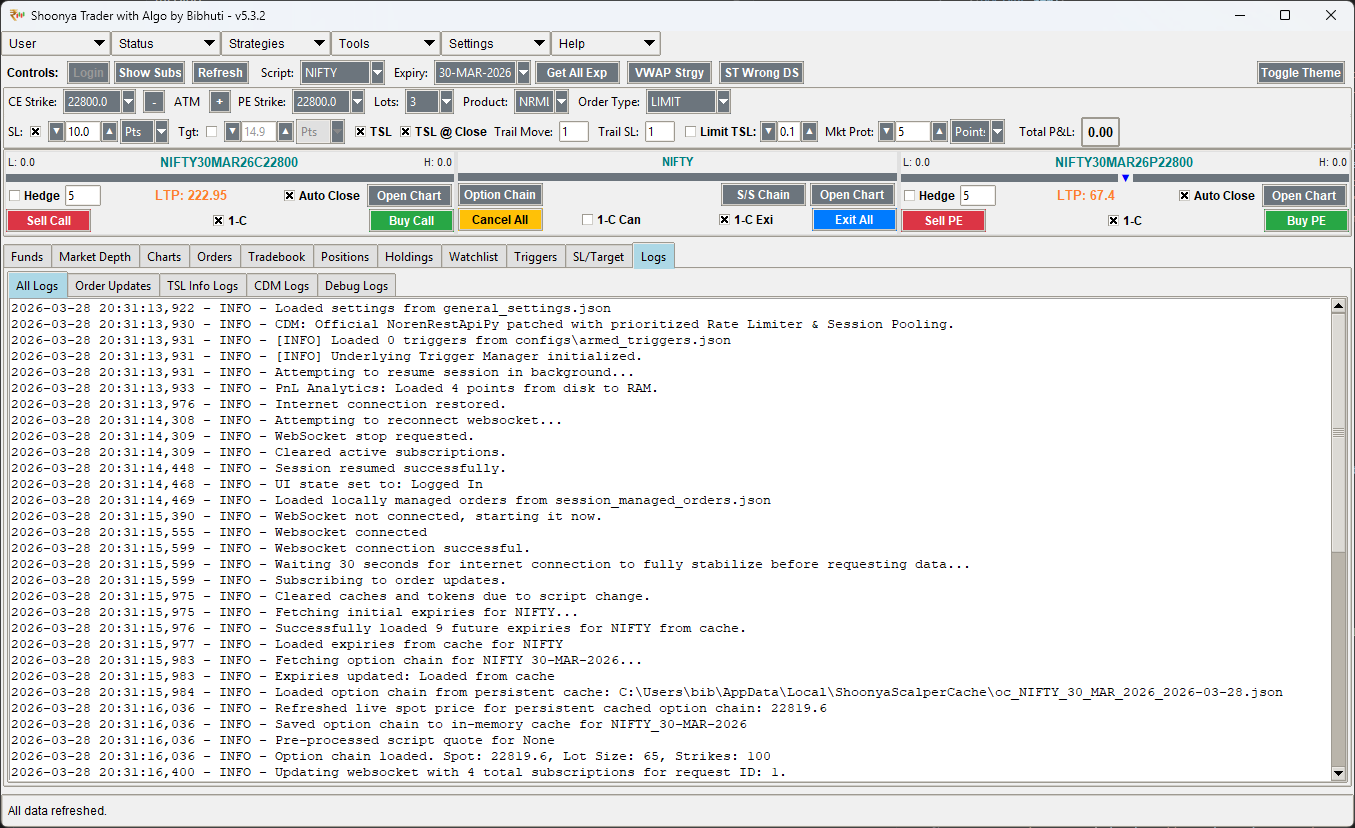
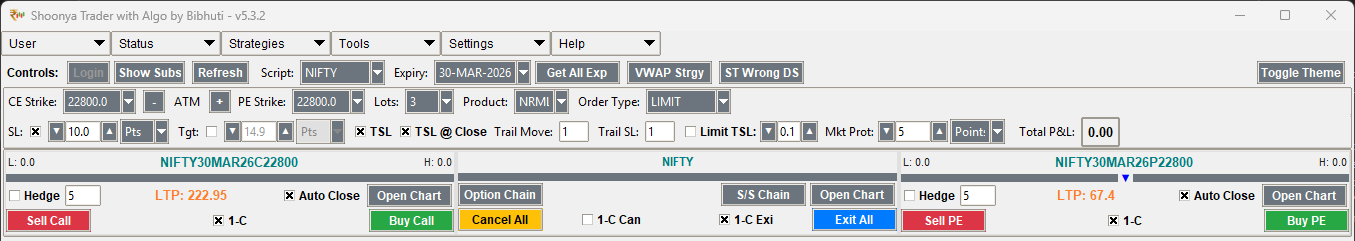
Main Dashboard
The central command center showing market depth, order controls, and real-time logs.
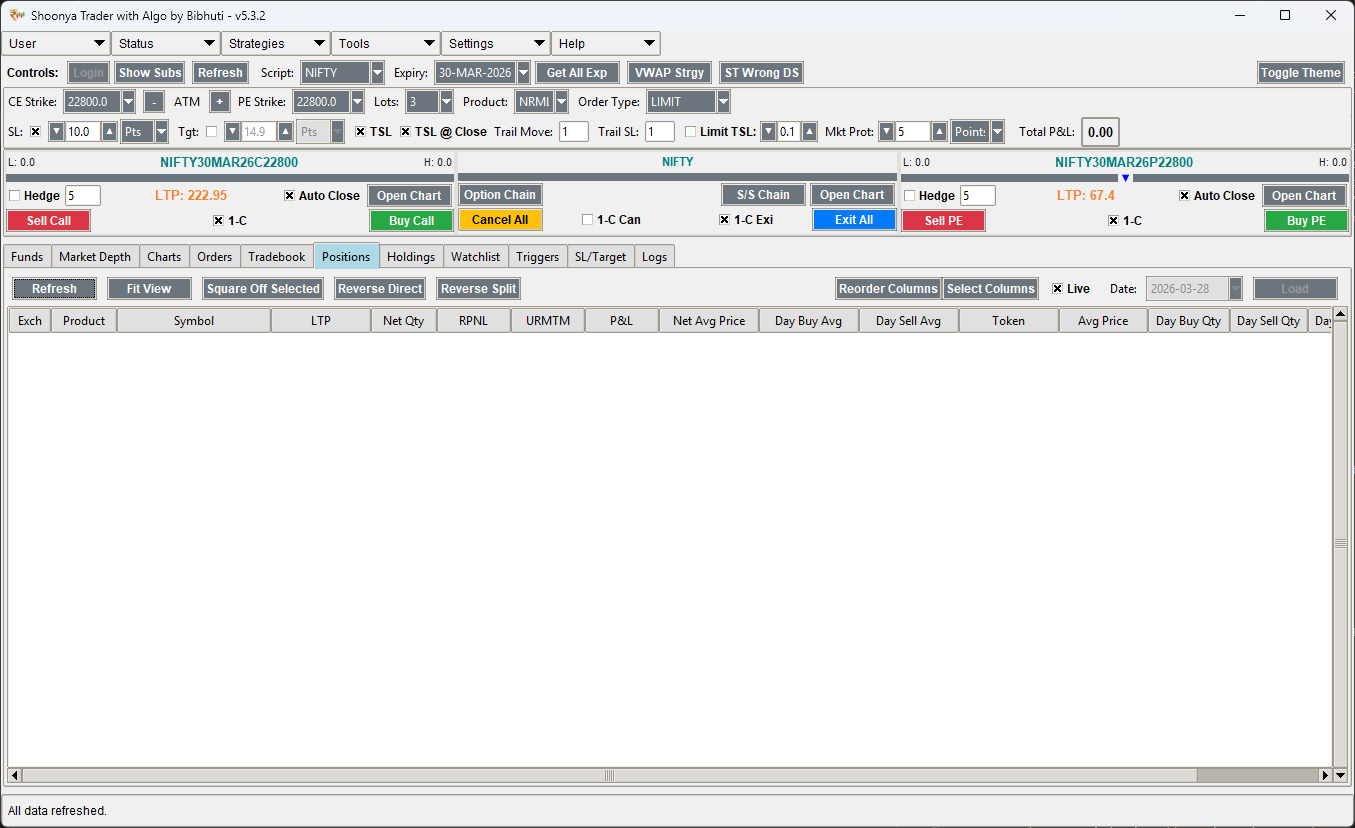
Positions & P&L
Live monitoring of open positions, current MTM, and overall portfolio health.
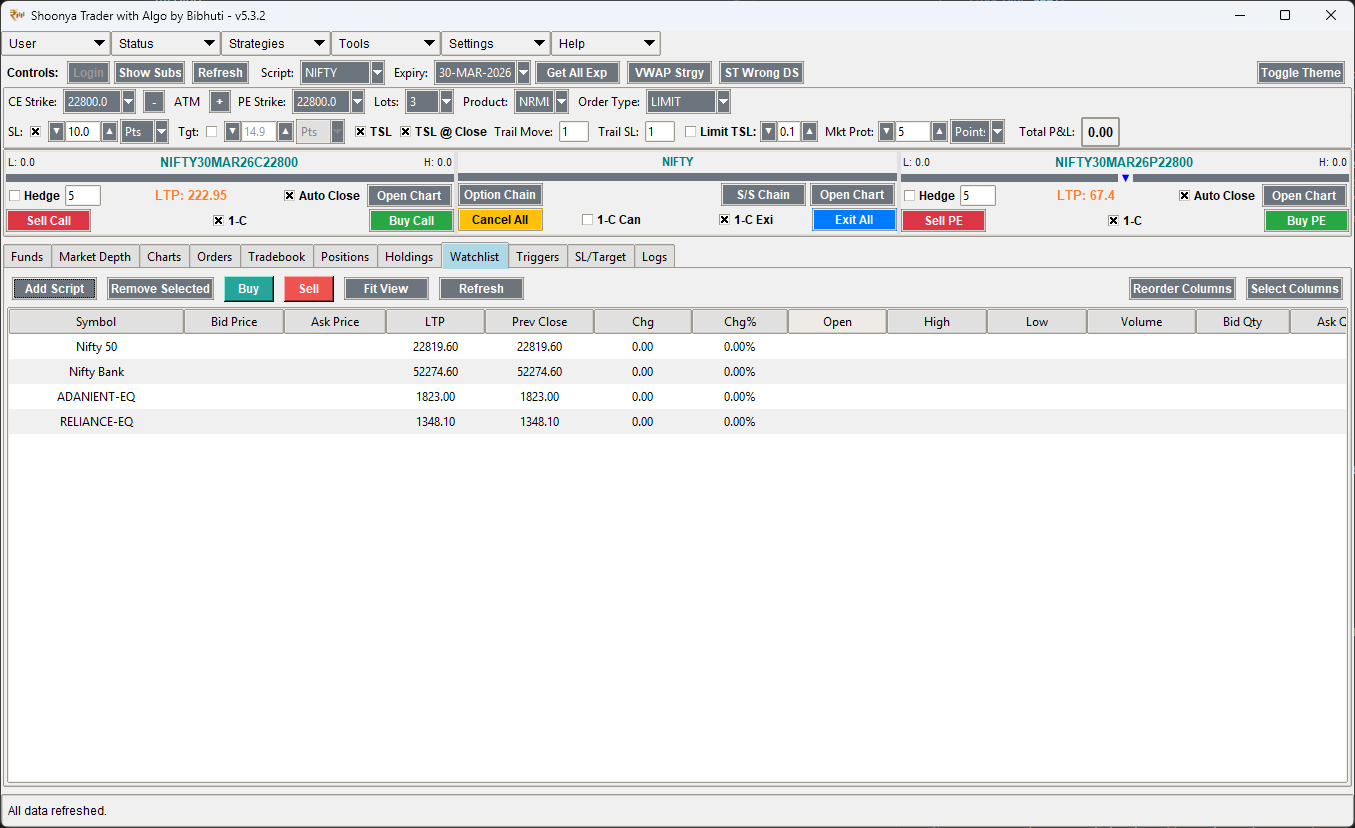
Watchlist Manager
Powerful, real-time script monitoring with advanced search and customizable layouts.
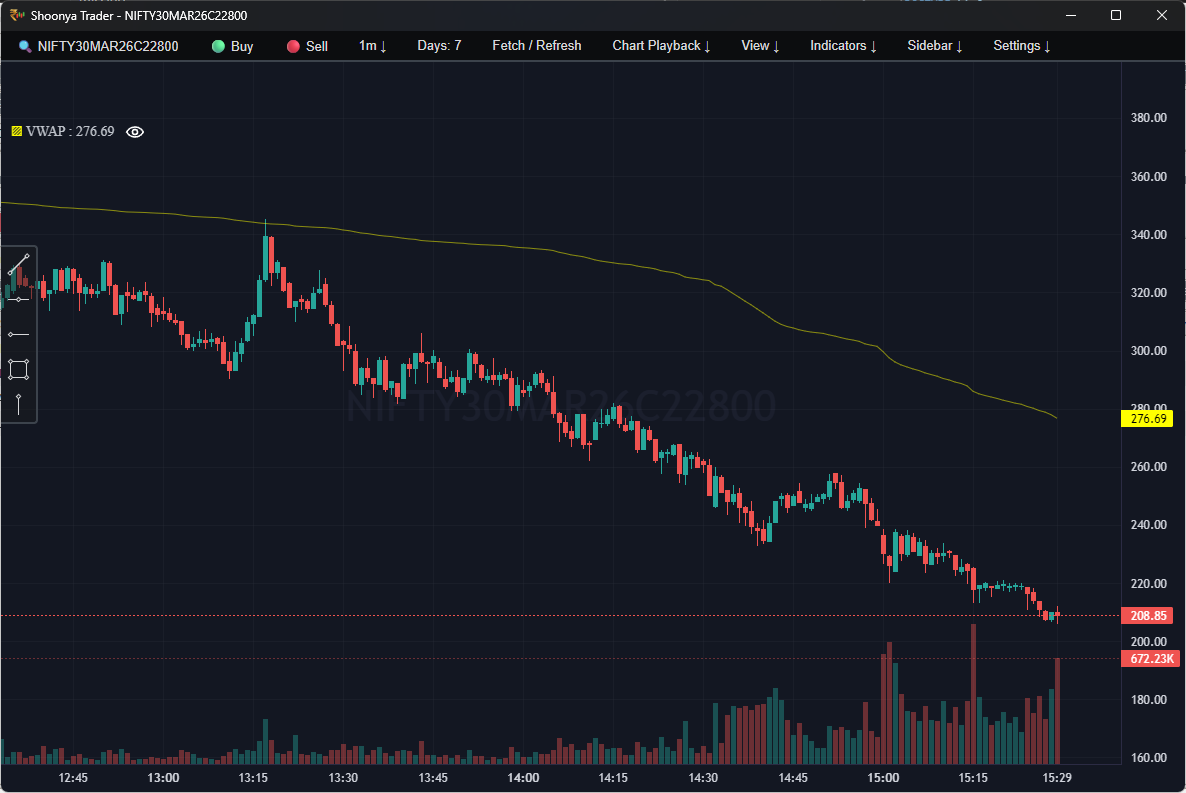
TradingView Charts
Institutional-grade charting integration with direct 'Trade from Chart' buttons.
Scalp Panel
Optimized controls for high-speed manual scalping and lot management.
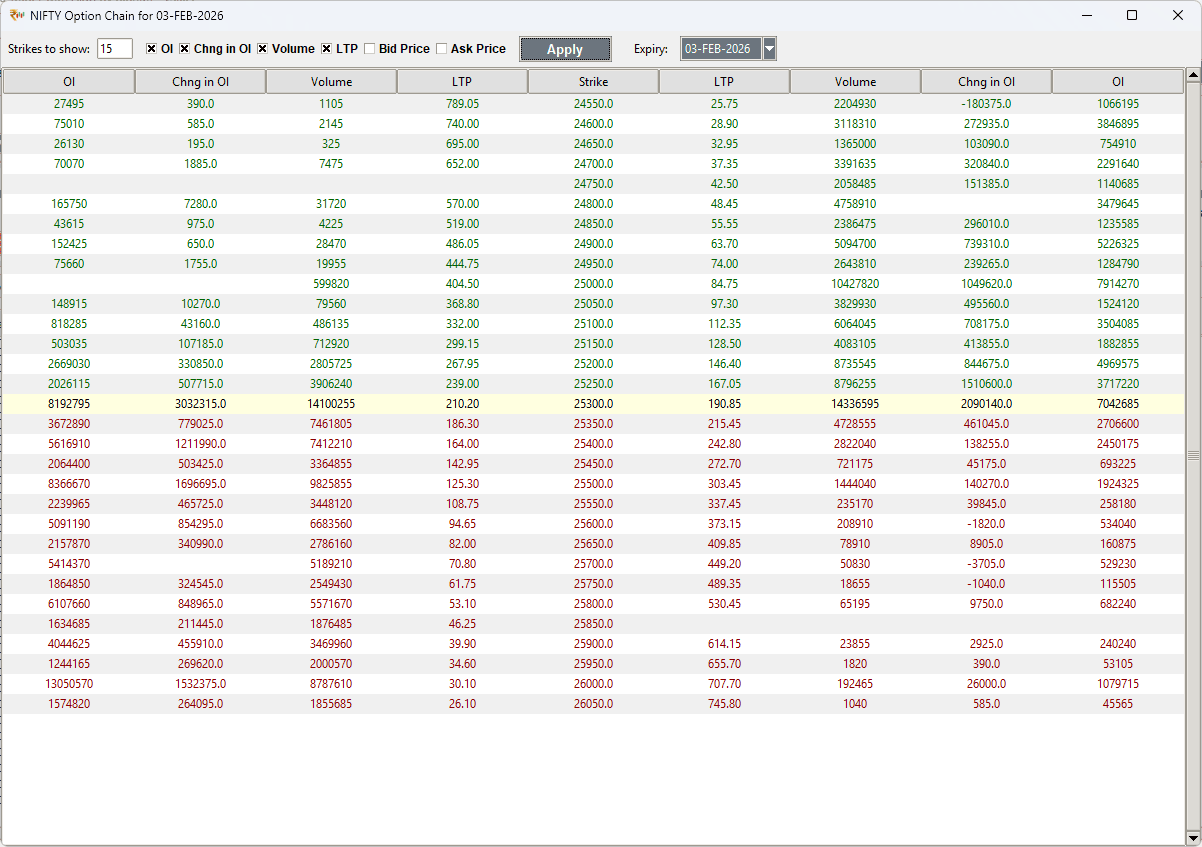
Option Chain
Comprehensive option chain for Nifty/BankNifty with Greeks and OI data.
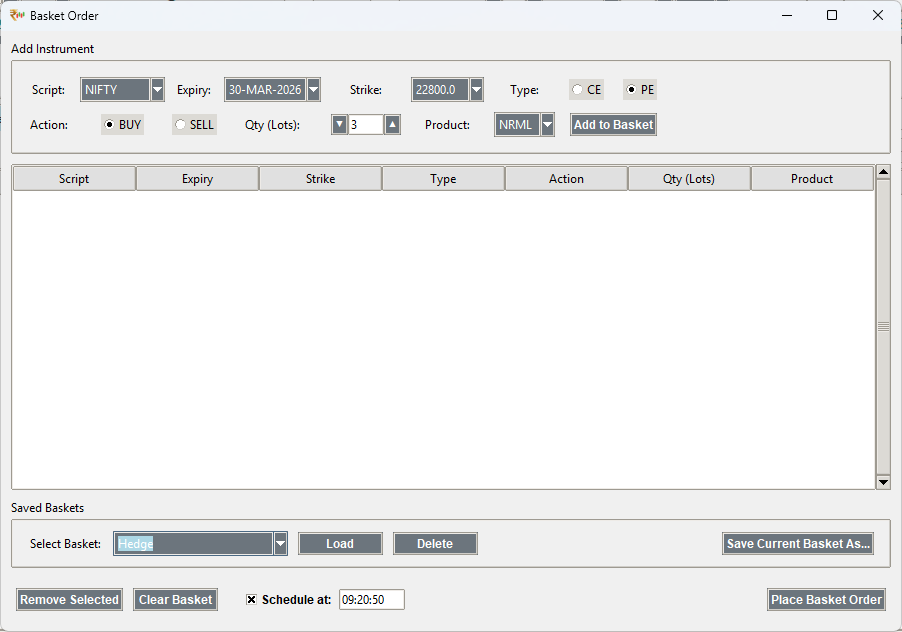
Basket Orders
Execute complex multi-leg strategies with single-click precision.
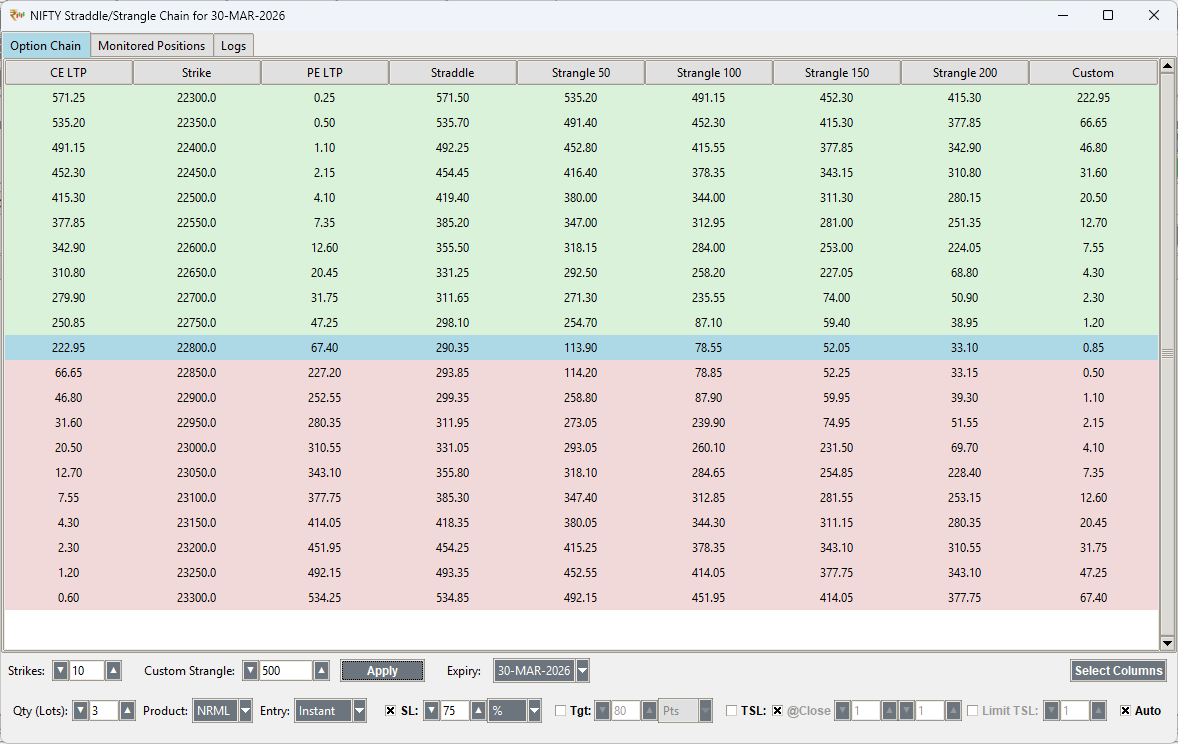
Straddle/Strangle
Automated execution modes for non-directional option strategies.
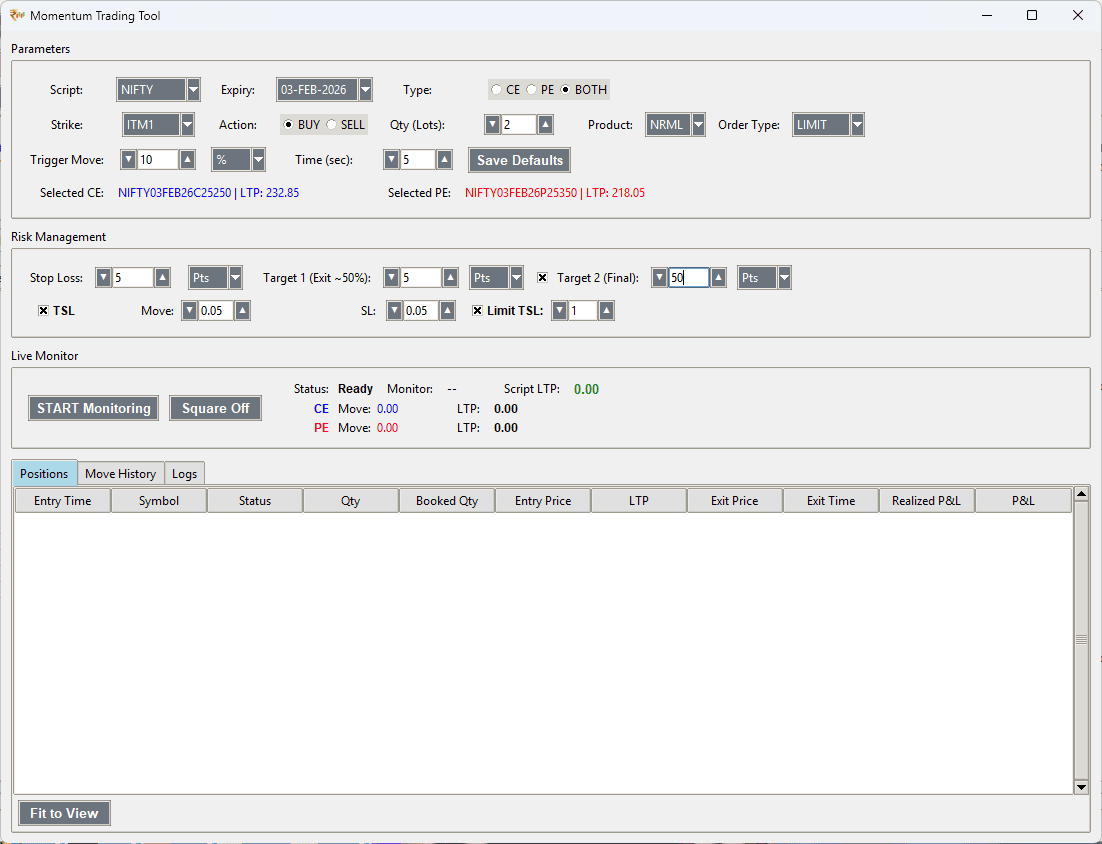
Momentum Trading
High-speed interface for capturing rapid market price movements.
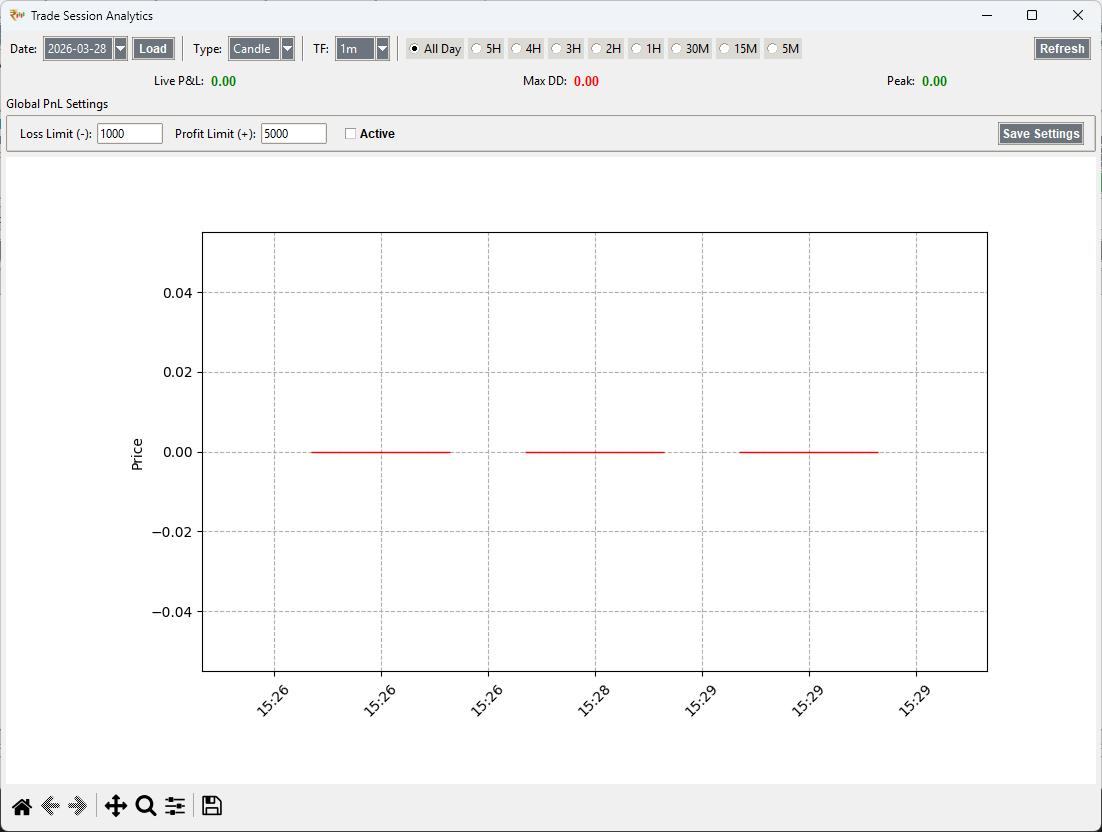
PnL Analytics
Advanced performance visualization with equity curves and session archives.
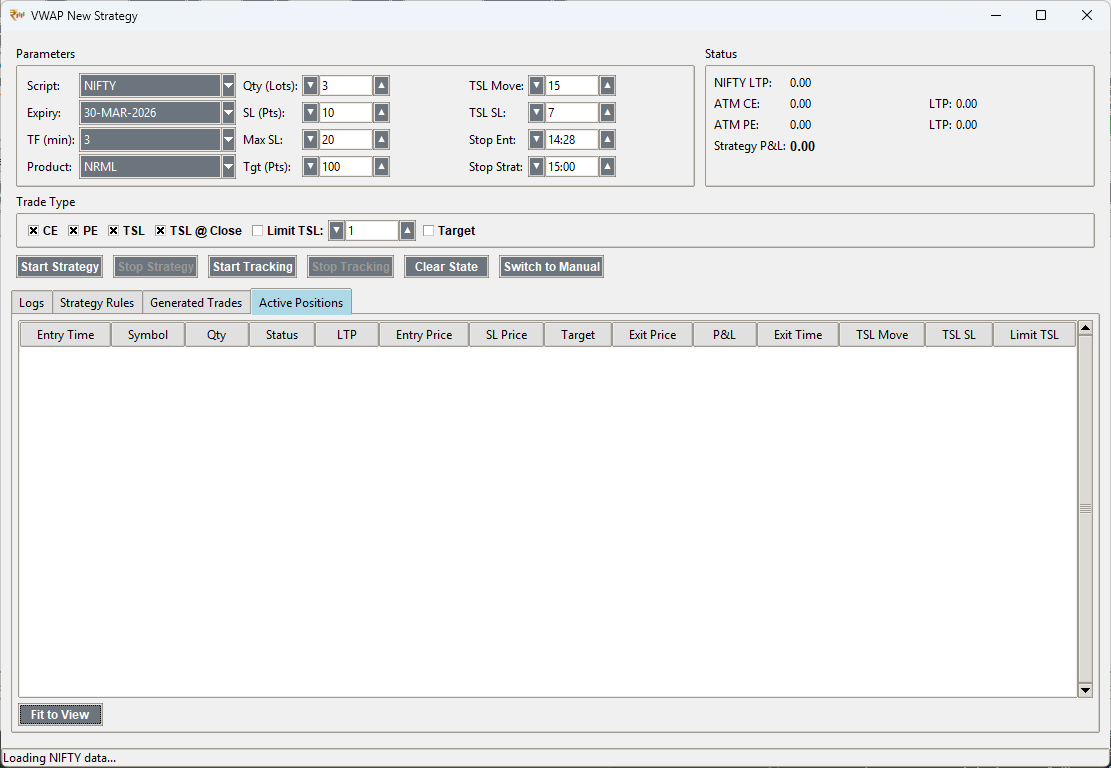
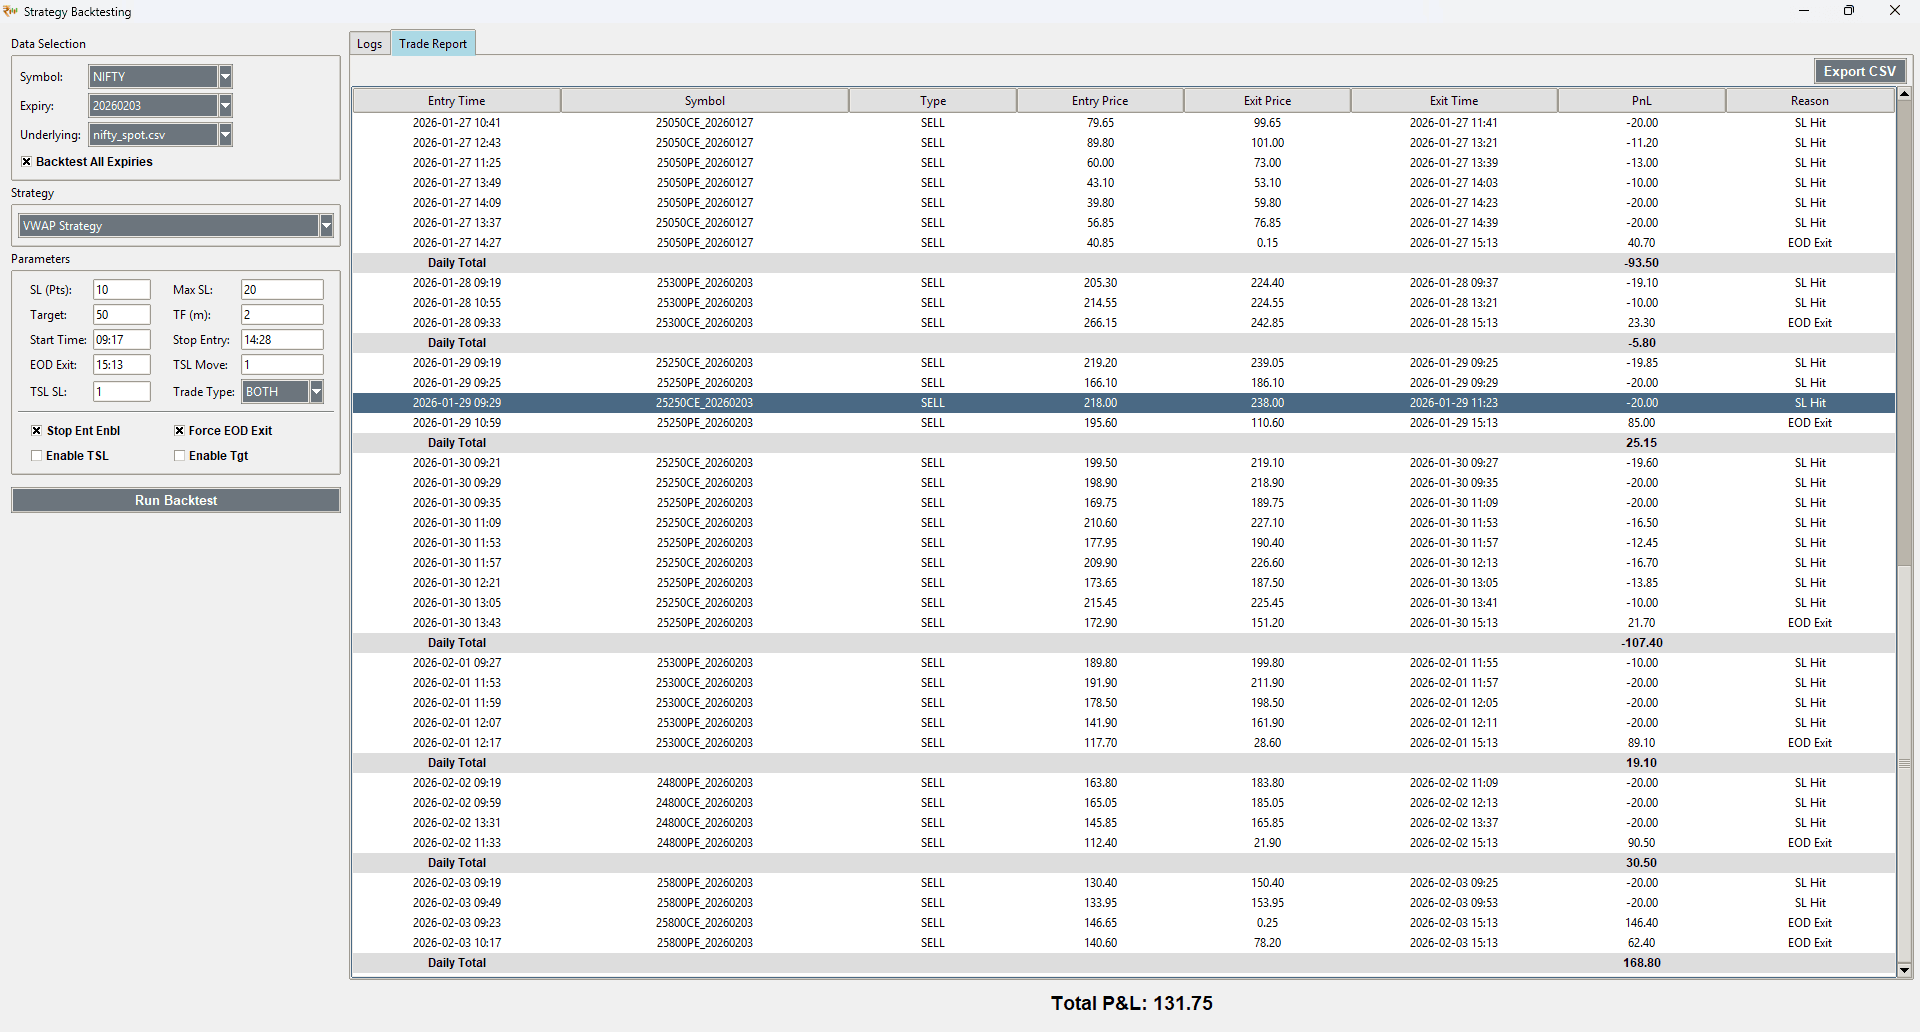
VWAP Strategy
Automated trend-following algo with adaptive risk management.
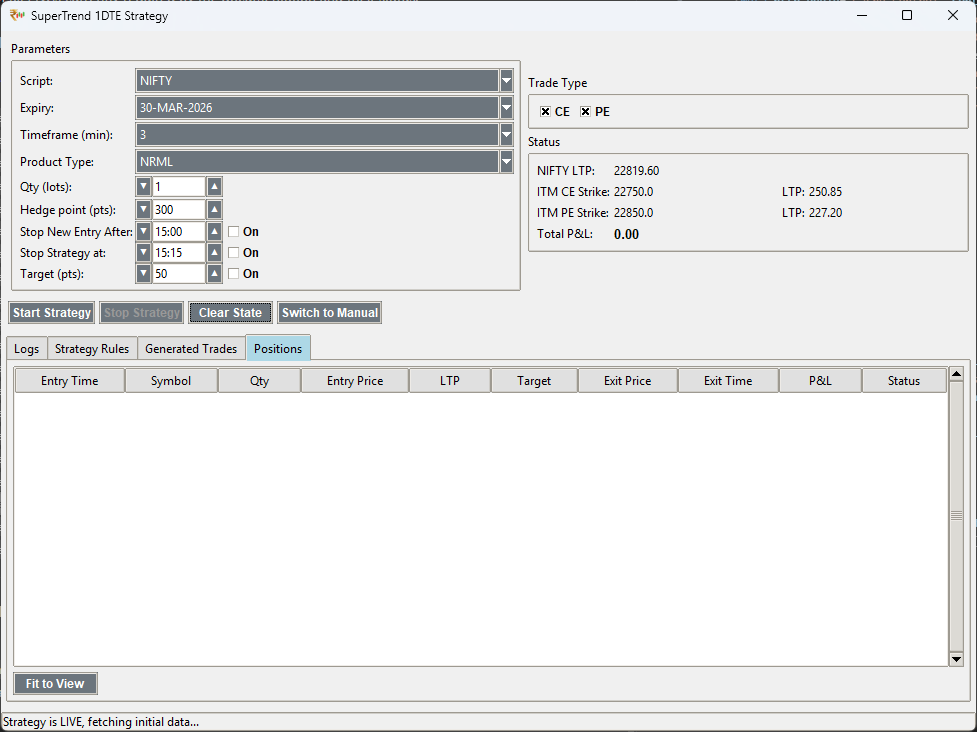
SuperTrend 1DTE
Hedged, positional strategy specifically for short-term option selling.
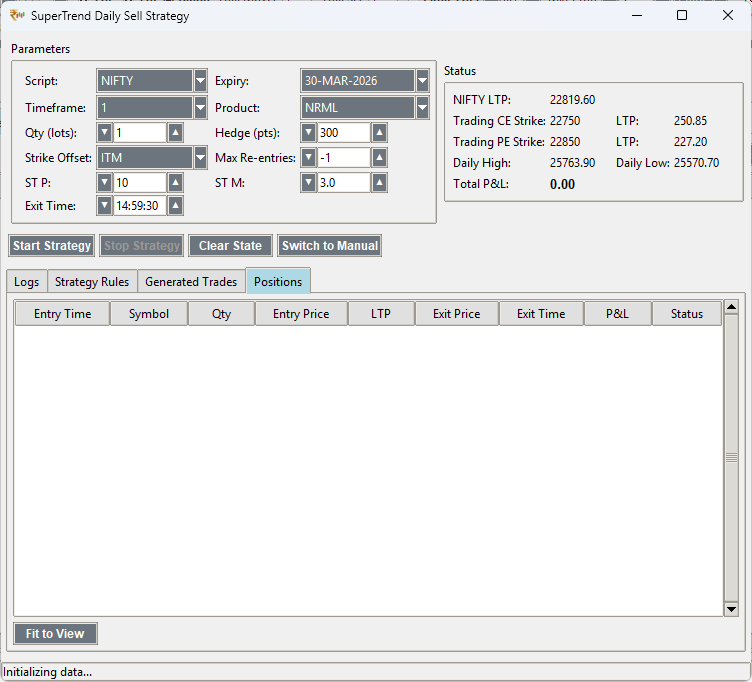
ST Daily Sell
Systematic selling strategy based on daily trend bias lock.
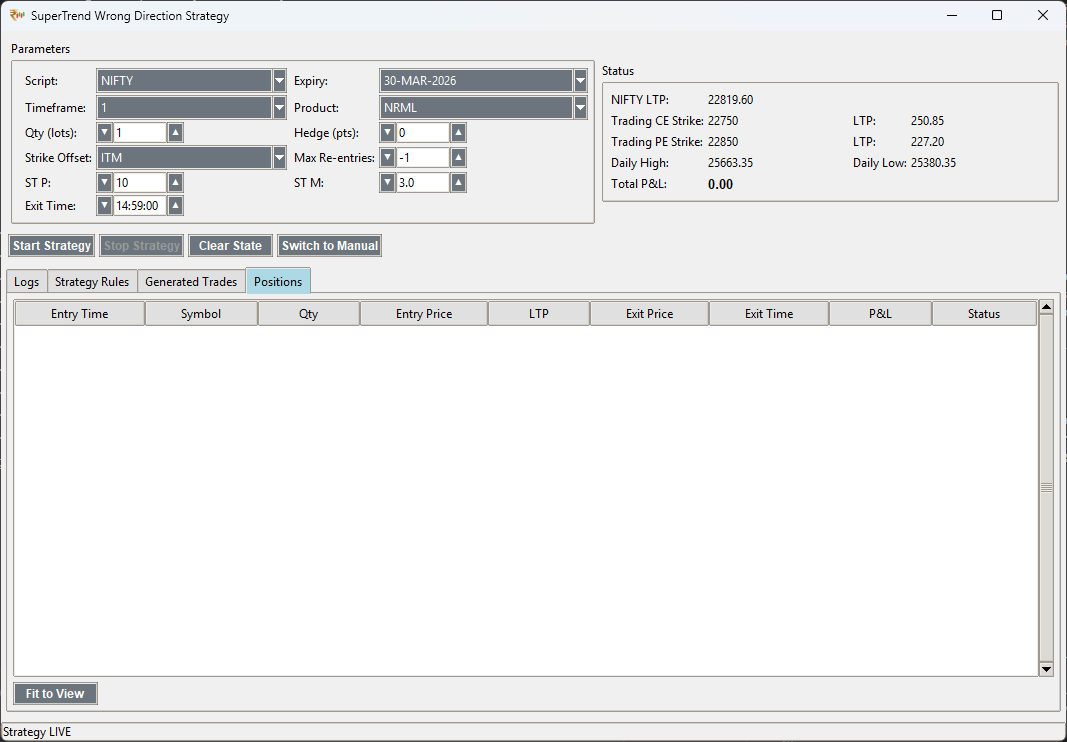
ST Wrong Direction
Mean-reversion algo designed to capture sharp market reversals.
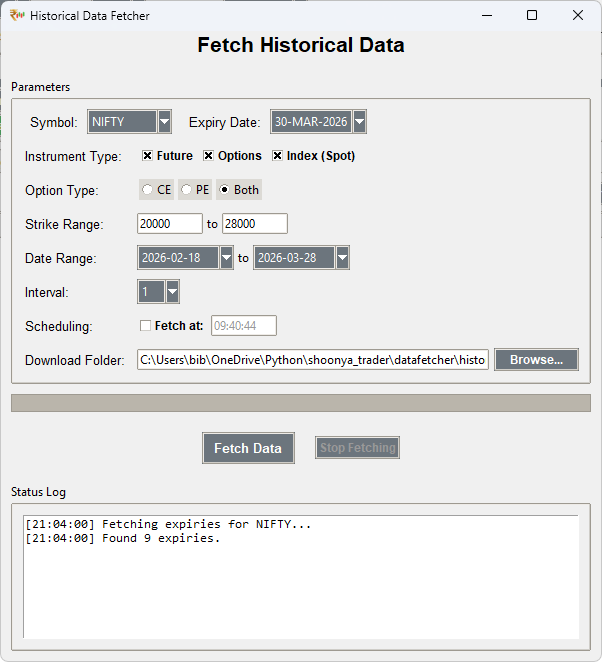
Data Fetcher
Integrated tool to download tick-by-tick and candle data for analysis.
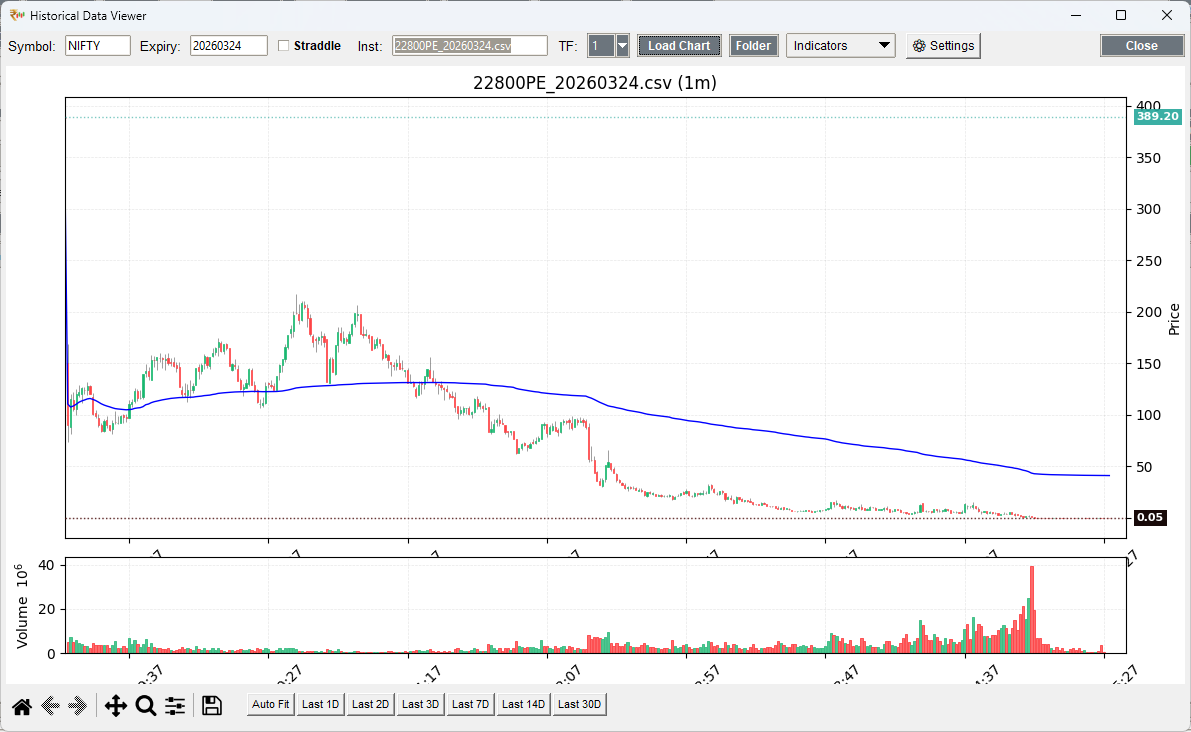
Data Viewer
Visualize historical market data with full indicator support.
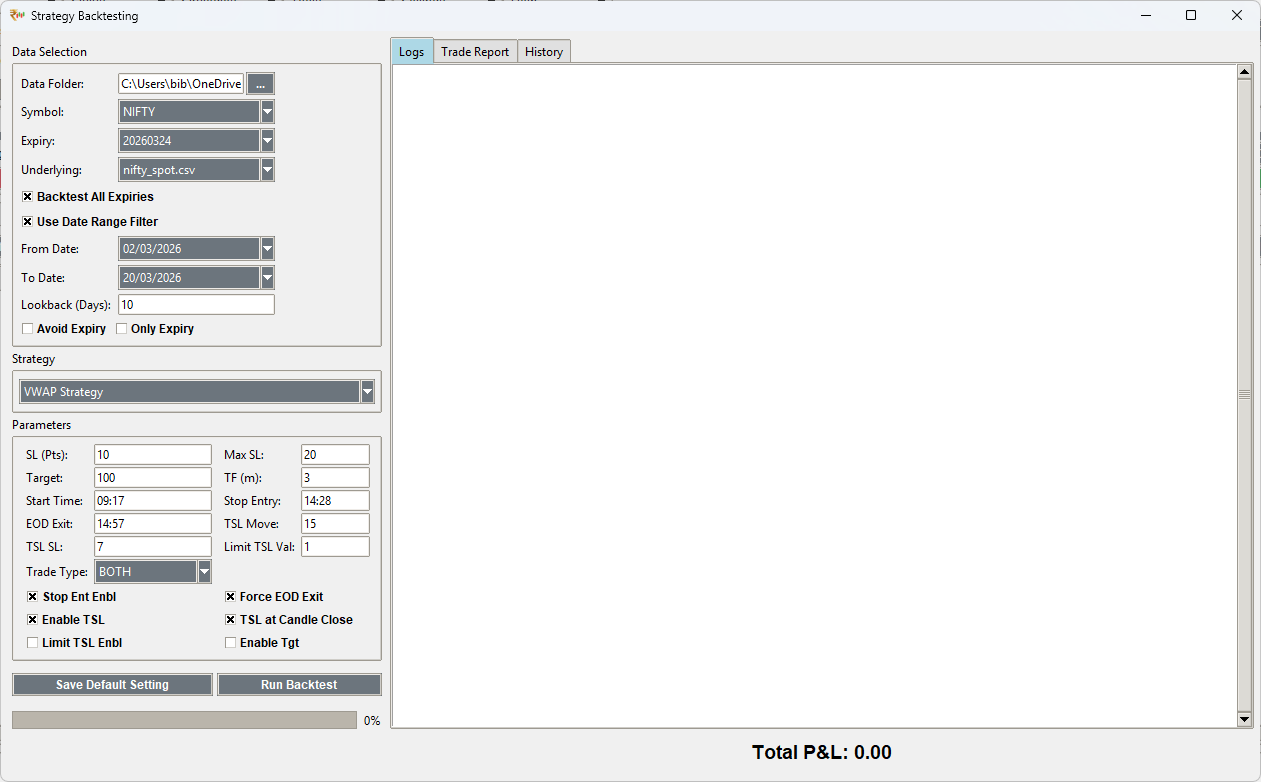
Backtest Engine
Institutional-grade precision for validating any strategy against years of data.
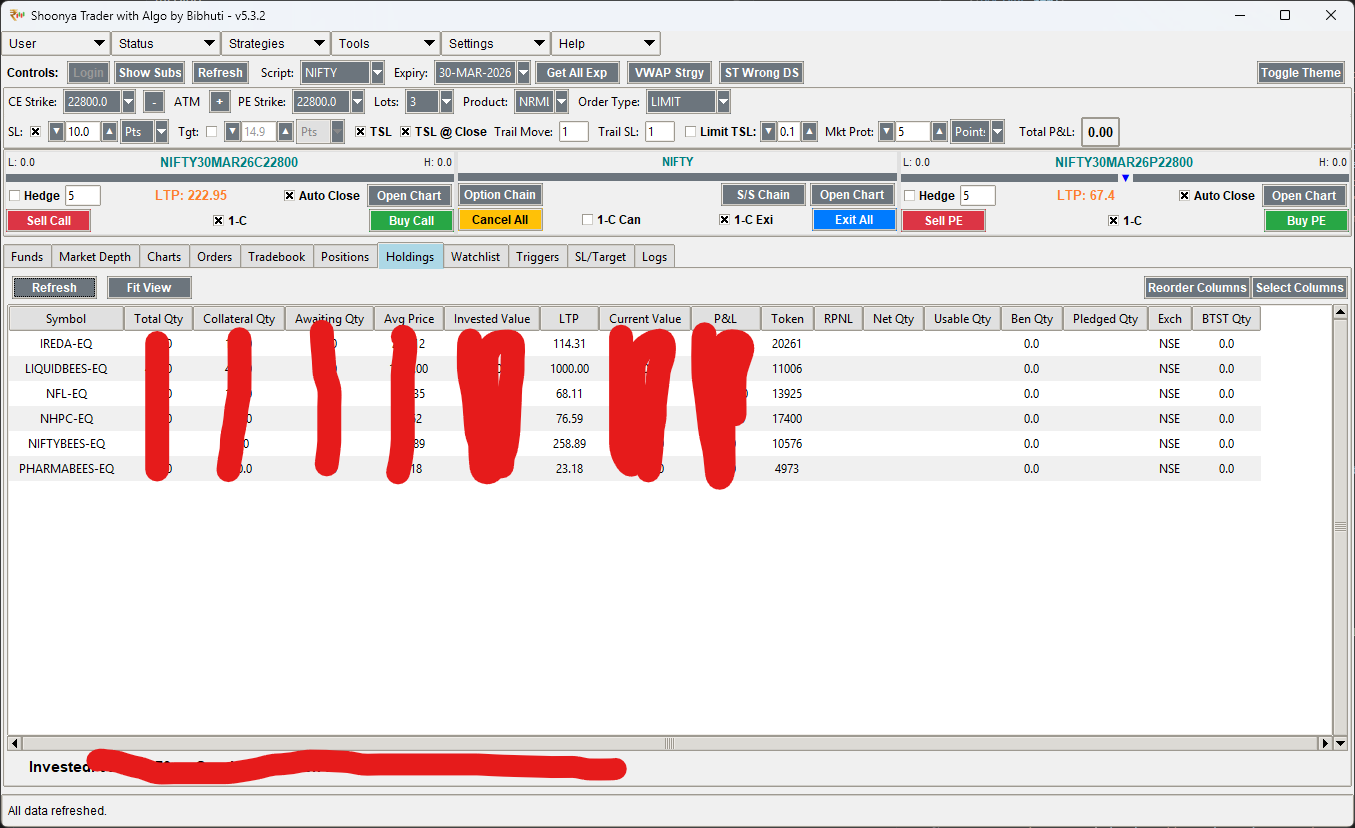
Holdings & Portfolio
Real-time valuation and management of your long-term equity delivery positions.
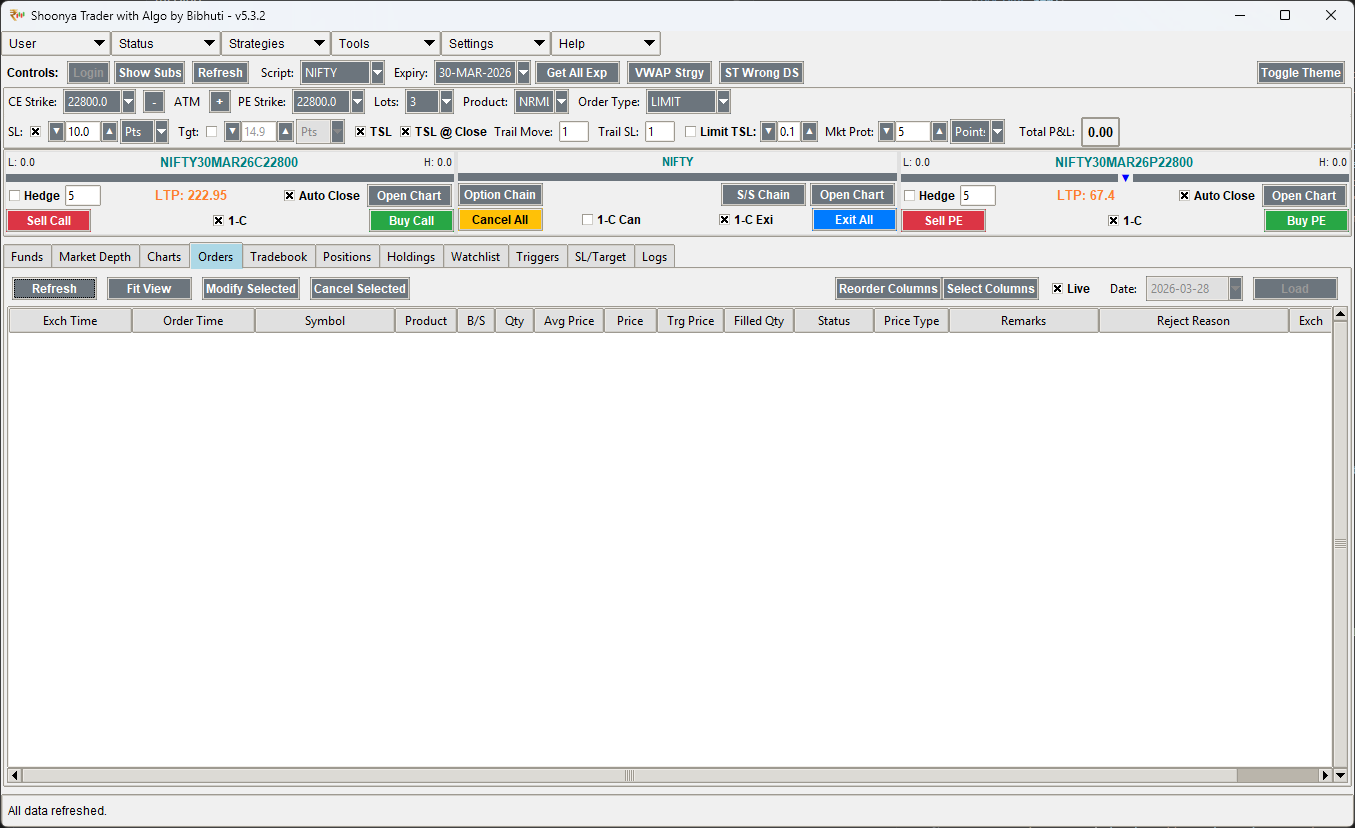
Order History
Precise audit log of every transaction attempt and status change.
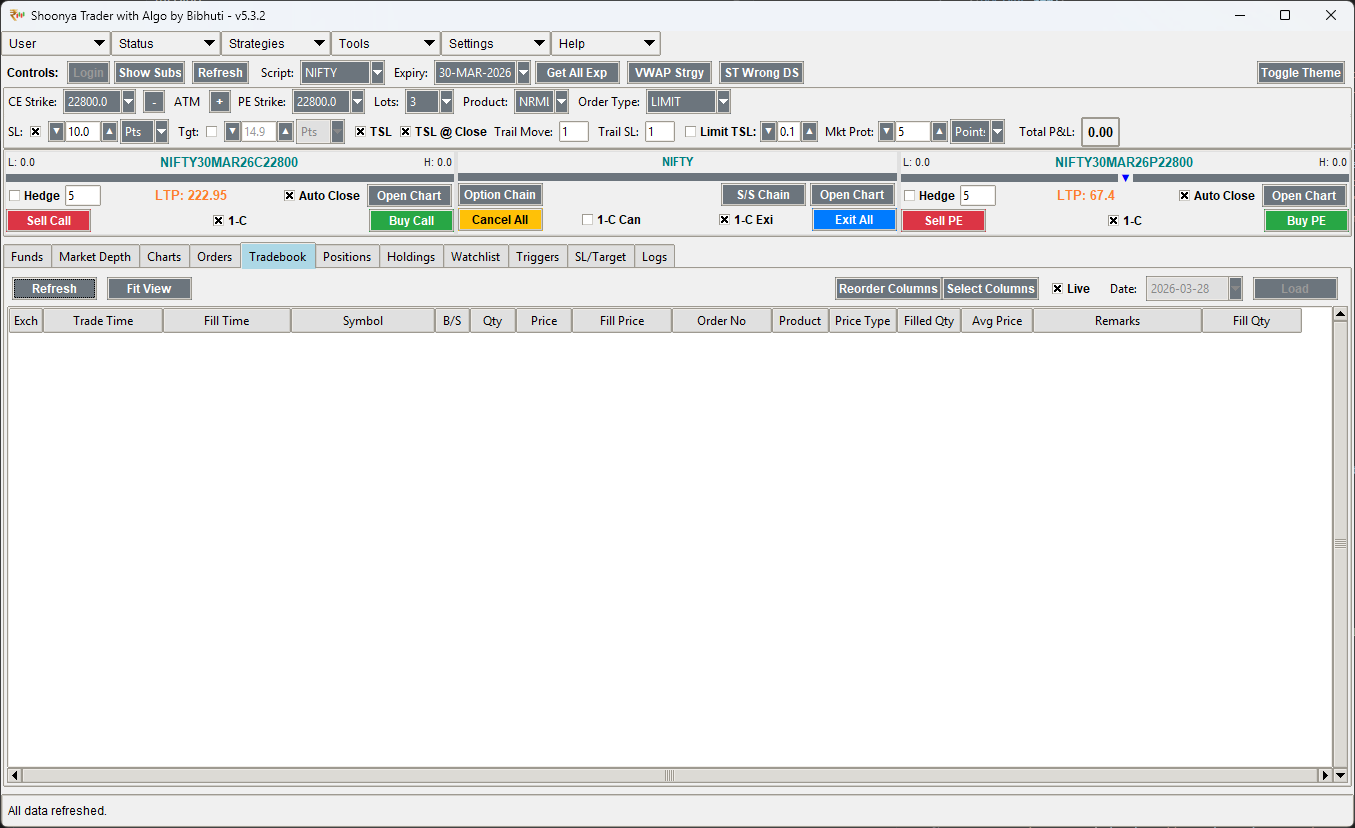
Tradebook
Consolidated summary of executed trades for session review.
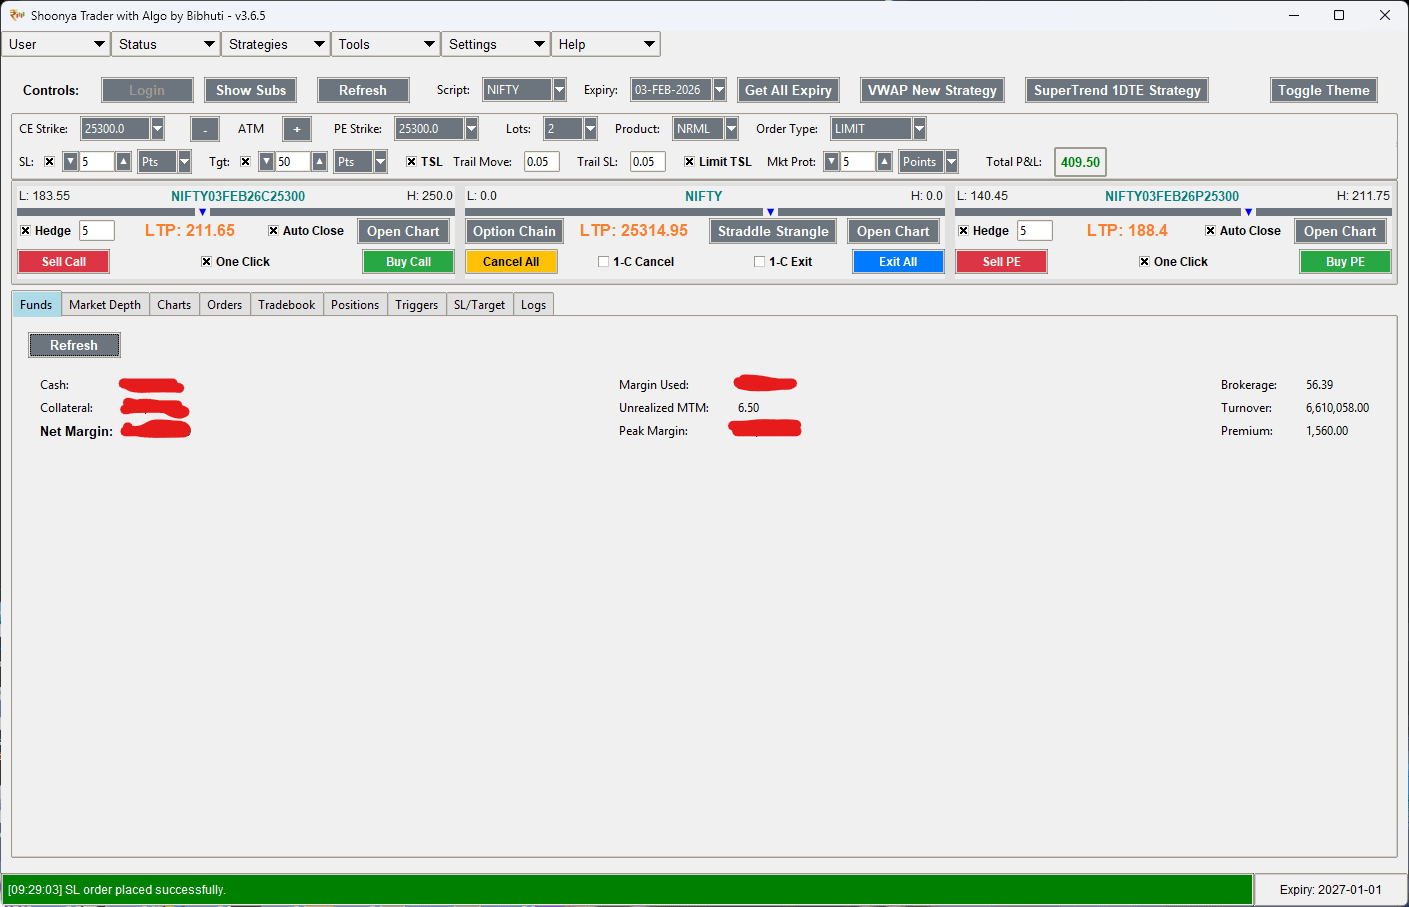
Funds & Margins
Real-time tracking of available margin and cash utilization.
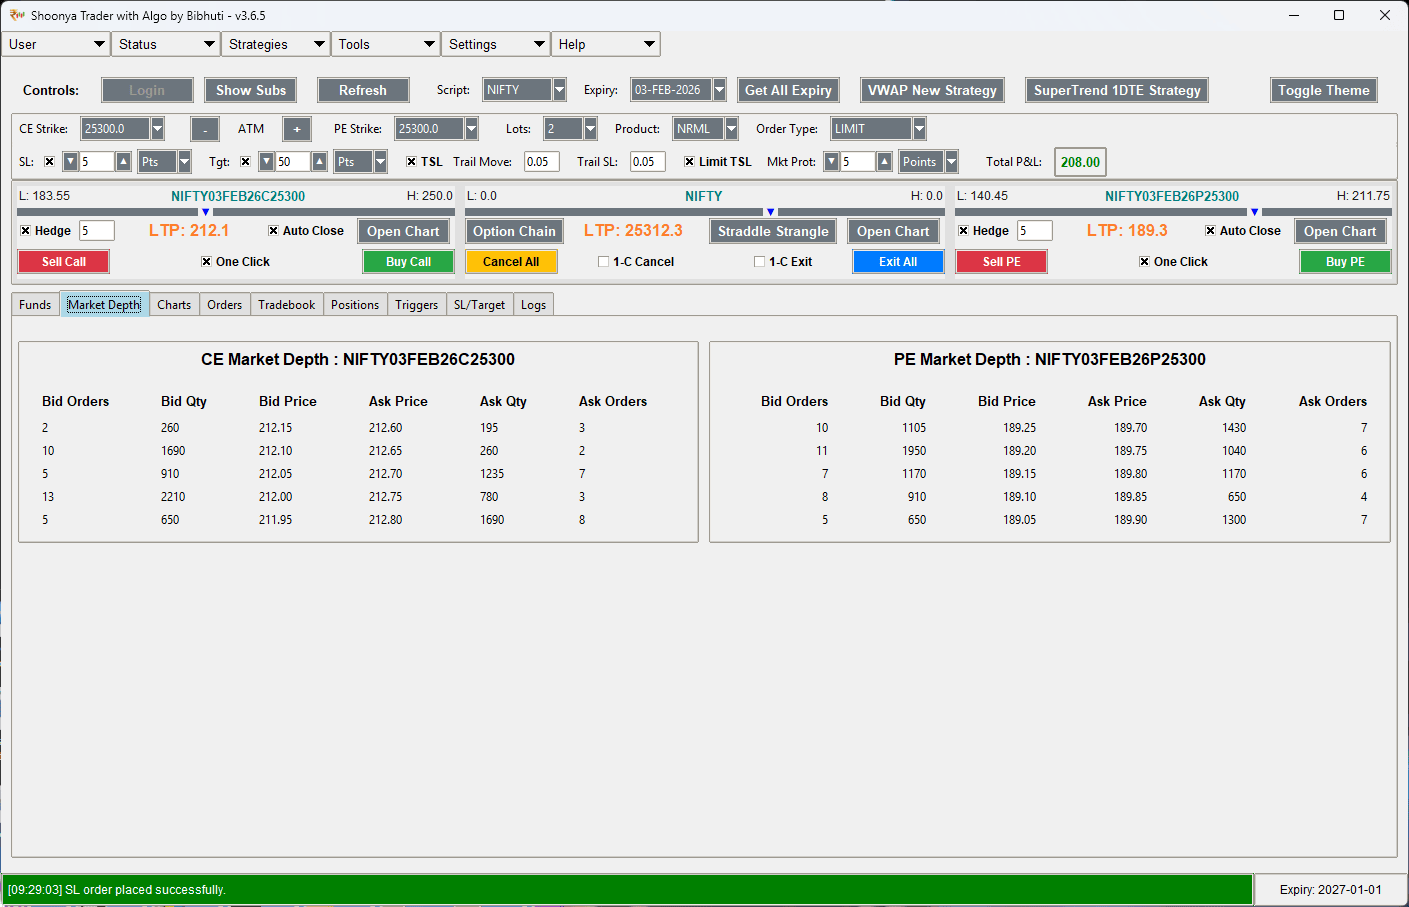
Market Depth (L2)
Visualization of top 5 buyers and sellers for liquidity analysis.
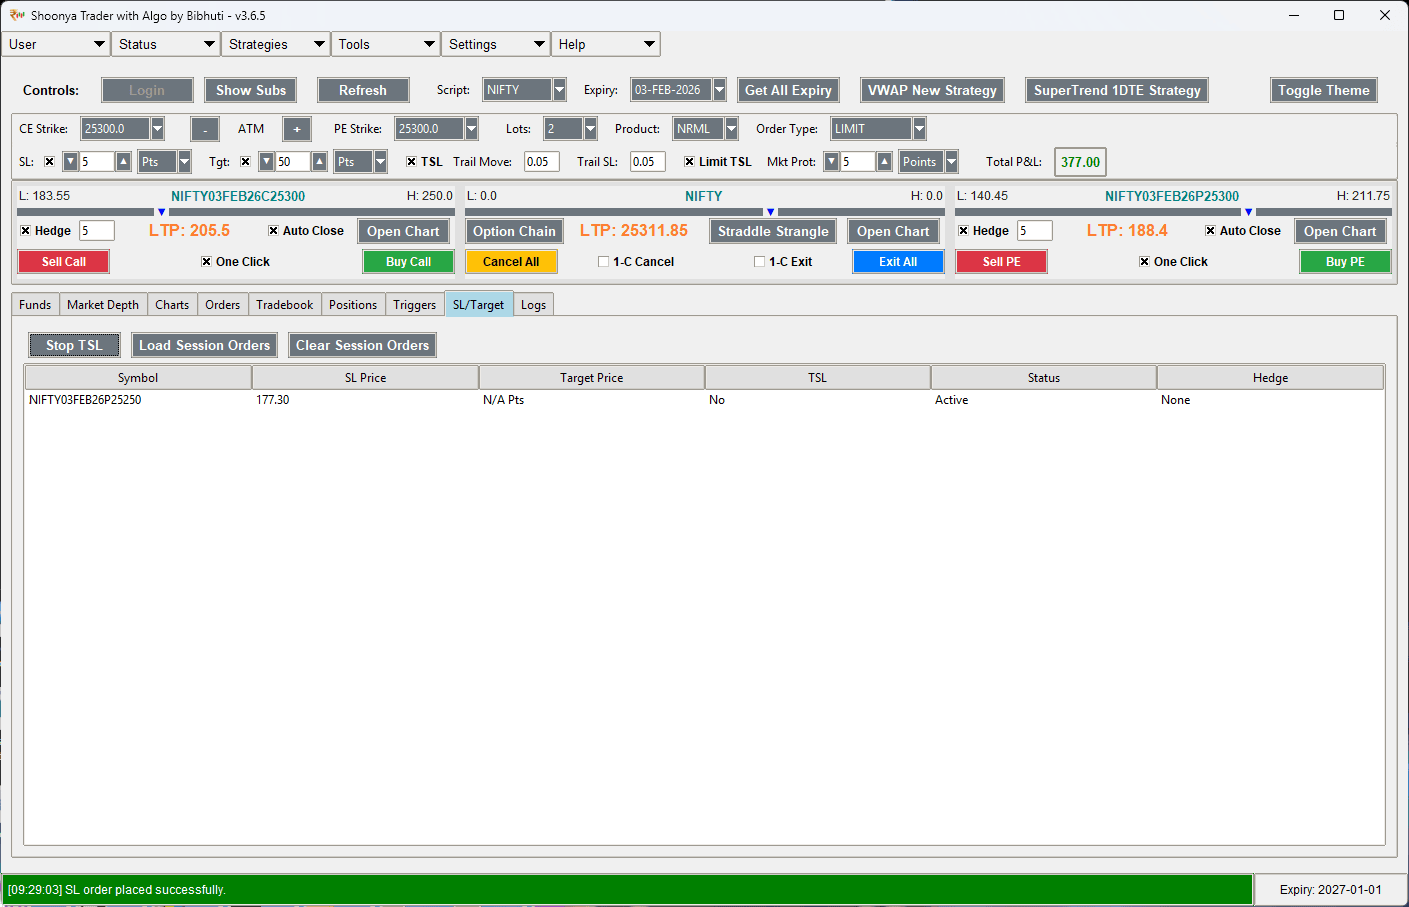
Safety Monitoring
Active local monitoring of Stop Loss and Target conditions.
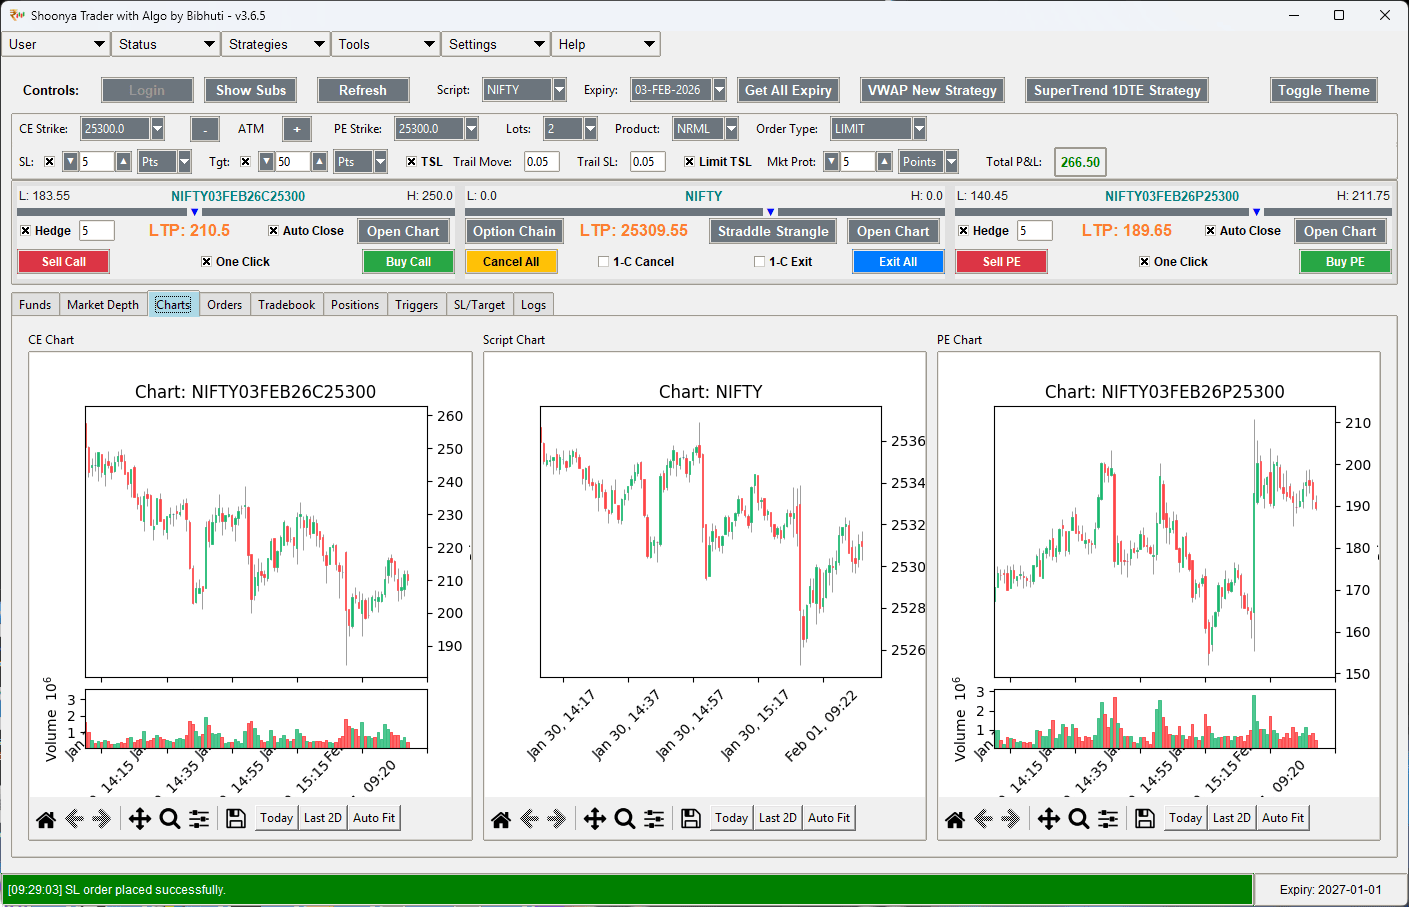
Legacy Charts
Alternative charting engine for simple indicator visualization.
Simulation Logs
Detailed step-by-step logs from strategy simulation runs.